What is the main focus of the 'Single & Multi-Cloud Cost Analysis' blog series?
The 'Single & Multi-Cloud Cost Analysis' blog series educates readers on how to calculate the Total Cost of Ownership (TCO) for cloud environments. It covers factors affecting cloud costs in scenarios such as Intra-Cloud, Inter-Cloud, and On-prem Cloud, explores Multi-Cloud use cases and TCO, and introduces Alkira's Network-as-a-Service (NaaS) solution, including tools like Cloud Insight for usage analysis and operational cost optimization. Read more.
What are the key factors affecting cloud costs according to Alkira's analysis?
Key factors affecting cloud costs include compute resources (instance type, number, network speed, operating system, operational hours, payment model), storage (type, volume, size), networking and security (virtual routers, firewalls, CSP transit), logging and monitoring (data volume, flow logs, alerts), data transfer (egress and intra-cloud), and additional service charges (e.g., NAT, CSP transit). Human capital costs for design, deployment, and maintenance are also significant. See detailed breakdown.
How does Alkira help organizations analyze and optimize cloud networking costs?
Alkira provides the Cloud Insights tool, which offers instant inventory and insights into your cloud networking resources. It helps organizations efficiently use resources and optimize operational costs by providing visibility into cloud network usage. Try Cloud Insights for free.
What are some example cost breakdowns for intra-cloud scenarios in AWS and Azure?
The blog provides detailed cost breakdowns for intra-cloud scenarios, including compute (e.g., EC2 or Azure VM), storage (EBS or SSD), data transfer, and firewall insertion. For example, in AWS, the total monthly TCO for a scenario with 10 VPCs and 10 instances (without firewall) is
,414/month, while with firewall insertion, it increases to ,354.44/month. Similar calculations are provided for Azure. See full calculations.
Pricing & Plans
What is Alkira's pricing model and how is it determined?
Alkira offers flexible pricing models, including consumption-based (pay-as-you-go) and commitment-based options. Pricing is determined by the quantity and size of network elements (such as Alkira Cloud Exchange Points), connectors, next-generation firewalls, and data egress. Fixed hourly rates are available for specific connector types and bandwidth. Customers can view live pricing details from the portal or via APIs. Learn more about Alkira pricing.
Features & Capabilities
What are the key features and benefits of Alkira's platform?
Alkira's platform offers Network Infrastructure-as-a-Service (NIaaS), Global Backbone-as-a-Service, integrated security (including Zero Trust Network Access and next-generation firewalls), a drag-and-drop interface for ease of use, comprehensive single-pane-of-glass visibility, cost savings (up to 40% lower TCO), and automatic scalability to match bandwidth demand. These features simplify cloud networking and transform enterprise connectivity. Explore Alkira's platform.
What integrations does Alkira support?
Alkira integrates with leading technology providers and platforms, including Cisco SD-WAN, Palo Alto Networks, Fortinet NGFW, F5, Splunk, ServiceNow, Infoblox, Aruba SD-WAN, Terraform, and Itential Automation Platform. These integrations enable secure, scalable, and automated cloud networking. See all technology partners.
Does Alkira provide APIs for integration and cost management?
Yes, Alkira offers APIs, including billing APIs that provide real-time cloud network cost data. These APIs can be integrated with other cost management tools and dashboards for automated synthesis and optimization. Learn more about Alkira APIs.
What technical documentation and resources are available for Alkira's solutions?
Alkira provides whitepapers (e.g., On Demand Next-Generation Cloud Firewalls), solution briefs, and a dedicated wiki with detailed technical information. These resources support prospects and customers in evaluating and implementing Alkira's solutions. Access Alkira resources.
Product Performance & Security
What performance improvements can customers expect from Alkira?
Alkira's platform reduces cloud setup time by 96% and network management time by 47%, enabling faster deployment and streamlined operations. Customers can achieve up to 40% lower Total Cost of Ownership (TCO) compared to traditional solutions, with measurable ROI benefits. The platform also ensures high-performance networking with automatic scalability. See performance details.
How does Alkira ensure security and compliance?
Alkira is SOC 2 and PCI-DSS compliant, demonstrating strong operational controls and protection of customer data. Integrated security features include Zero Trust Network Access (ZTNA) and next-generation firewalls. Customers are encouraged to follow best practices for user access management. Read about Alkira's compliance.
Use Cases & Benefits
What problems does Alkira solve for enterprises?
Alkira addresses operational complexity, multicloud and hybrid cloud networking challenges, security vulnerabilities, and lack of scalability and visibility. The platform simplifies network design, eliminates manual configurations, integrates advanced security, and provides comprehensive visibility and governance. Learn how Alkira solves these problems.
Who can benefit from Alkira's solutions?
Alkira is designed for mid-to-large enterprises across industries such as manufacturing, healthcare, telecommunications, financial services, biotechnology, software technology, retail, media & entertainment, and aviation. Target roles include network architects, cloud architects, security architects, IT managers/directors, CloudOps, CIOs, CTOs, and CISOs. See customer stories.
What are some real-world examples of Alkira's impact?
Notable case studies include:
Michaels: Transformed its network across 1,400 stores in record time. Read the case study.
Koch Industries: Simplified multicloud networking and improved agility. Watch the video.
Warner Hotels: Enhanced networking efficiency and visibility. Watch the video.
Chart Industries: Improved agility, saved costs, and expanded globally. Watch the video.
SITA: Integrated on-premises and cloud environments for aviation. Watch the video.
Customers can implement a proof of concept in as little as 4 hours, with full production deployment typically taking about 8 weeks. Alkira provides a drag-and-drop interface, a dedicated training platform, 24×7 monitoring, and dedicated support to ensure a smooth onboarding process. Explore Alkira's training platform.
What feedback have customers given about Alkira's ease of use?
Customers have praised Alkira for its simplicity and speed. For example, a network architect at a large manufacturer said, "The IT DIY approach was going to take 6 months to be secure and redundant and all. Alkira did it for us in 3 days, and at very low cost." Matt Hoag, CTO at Koch Industries, noted, "We had gone from a mass of complexity and months of work to a dashboard that allowed us simply to draw our network and deploy it in a few hours." Read more testimonials.
Competition & Comparison
How does Alkira compare to competitors like Aviatrix, Prosimo, Nefeli, and Cato?
Alkira differentiates itself by providing a true abstraction layer leveraging cloud providers' infrastructure, enabling single-click provisioning and eliminating manual configurations. Unlike Aviatrix (which focuses on orchestration overlays), Prosimo (application-centric networking), Nefeli (agent-based solutions), and Cato (SD-WAN focus), Alkira offers full-stack networking and security, global backbone-as-a-service, and integrated security features for both cloud and traditional network use cases. See detailed comparisons.
What are Alkira's competitive advantages?
Alkira's advantages include a vendor-agnostic approach (no lock-in), integrated security, ease of use with a drag-and-drop interface, rapid deployment (months to minutes), measurable ROI (96% reduction in setup time, 47% reduction in management time), and comprehensive visibility. These features make Alkira suitable for enterprises seeking to simplify multicloud networking and enhance operational efficiency. Learn more.
Support & Implementation
What support and training does Alkira offer to customers?
Alkira provides a dedicated training platform with guidance, demos, and resources, 24×7 monitoring, a diagnostics dashboard for troubleshooting, and dedicated support via email or support tickets. Customers receive proactive notifications about maintenance and benefit from continuous monitoring to meet SLA commitments. Access Alkira training.
How does Alkira handle maintenance, upgrades, and troubleshooting?
Alkira ensures seamless maintenance and upgrades with proactive notifications, a live diagnostics dashboard for troubleshooting, 24×7 monitoring, and dedicated support. Customers can report issues via email or support tickets, ensuring minimal downtime and operational disruption. Contact Alkira support.
Company Information & Vision
What is Alkira's vision and mission?
Alkira's vision is to transform enterprise connectivity by simplifying cloud networking for the AI era. Its mission is to eliminate the complexity of traditional hardware-dependent networking by providing a cloud-native solution that seamlessly connects hybrid and multi-cloud environments through a unified control plane. Learn more about Alkira.
What recognition and industry awards has Alkira received?
Alkira has been named among America’s Best Startup Employers by Forbes, recognized as a Gartner Cool Vendor, and received the 2024 Excellence Award from Cloud Computing Magazine. It was also listed on CRN’s 2023 Stellar Startups List. See company achievements.
Industries & Case Studies
Which industries are represented in Alkira's case studies?
Alkira's case studies span manufacturing, retail, healthcare, telecommunications, financial services, biotechnology/life sciences, software technology, media & entertainment, and aviation. Explore case studies.
Technical Requirements
What technical resources are available for evaluating Alkira?
Alkira offers whitepapers, solution briefs, and a technical wiki to help prospects and customers understand its solutions in depth. Access technical documentation.
Disclaimer: This blog aims to educate the audience on calculating the Total Cost of Ownership (TCO) in the Cloud. This blog does not compare the Cost between CSPs; the example used below is just to show the calculation.Big and Small Enterprises are either already in the cloud or plan to move to the cloud soon. Budgeting the Operational Expenses (OpEx) for planned workloads or architecture is vital for enterprises and one of the fundamental requirements of migrating to the Cloud.
Each cloud provider has unique pricing models, so understanding those models and factors affecting the cloud cost is very important to calculate the true cloud Total Cost of Ownership (TCO) of any solution.
This three-blog series will cover a high-level overview of factors that affect cloud costs in different scenarios like Intra-Cloud, Inter-Cloud, and On-prem Cloud. Then we will touch upon Multi-Cloud use cases and the TCO. Lastly, we’ll cover the Alkira NAAS solution, including Alkira’s tool for usage analysis and Cloud Insight, which will provide visibility into your cloud network and help you efficiently use your resources and optimize the operational cost.
This blog covers the different Intra-Cloud transit use cases, factors affecting the cost in those scenarios, and how to calculate the TCO for Intra-Cloud use cases.
Note: Kubernetes services are not part of this blog.
Factors Affecting Cloud Costs
Before we jump into different intra-cloud use cases and discuss calculating the TCO for those scenarios, we must understand various factors affecting cloud costs.
Let’s start with the Single Cloud vs. Multi-Cloud environment:
Single Cloud vs. Multi-Cloud
People presume that the Single Cloud solution will be cheaper than the Multi-Cloud environment, but this is not entirely true. Cloud TCO depends on data mobility and many other factors under Cloud Services. It is a fact that the cost variation per cloud provider creates complexity in calculating the TCO in a Multi-Cloud environment. Still, the business benefit of a Multi-Cloud environment is way more than a Single Cloud solution.
CapEx and OpEx
CapEx does not apply in the Cloud as cloud providers build the infrastructure, provide Infrastructure-As-A-Service (IAAS), and charge their customers for using their services; the more customers use, the more charges customers incur.
Similarly, OpEx in Cloud is also different; the Pay-As-You-Go (PAYG) model in the cloud is considered OpEx.
Cloud Services
Cloud service costs can be confusing and complex, but it is possible to calculate the TCO if one understands the resources used for their use cases.
The table below shows the resources examples and the factors that affect pricing:
Services
Resources Affecting Cost
Compute
Instance Type
Number of Instances
Network Speed
Operating Systems
Operational Hours
Payment Model (On-Demand, 1 or 3 years Upfront, etc.)
Storage
Types of Storages (S3/EFS/EBS or Blob/Table/Queue
Storage or Manage Disks)
Type of Volume (SSD, Magnetic or HDD, etc.)
Volume Size
Networking & Security
Virtualized WAN Router (Cisco SDWAN, Silver Peak, etc.)
Virtualized Firewalls (Palo Alto, Check Point, Fortinet, etc.)
CSP Transit (TGW, vWAN, DRG, etc.)
Logging and Monitoring
Volume of Data
Flow Logs
Number of Alerts
Data Transfer
Data egress cost in different regions or cloud
Data transfer cost within the cloud infrastructure
Other Services Charges:
Calculating the true TCO is not straightforward, and it requires the complete hop-by-hop understanding of the data transition. There are costs besides Cloud Services, for example, Inter-AZ charges, Elastic IP charges, Network Address Translation (NAT) charges, CSP Transit charges, etc., that also affect the overall TCO. We will see more details about the data transition between CSPs or between Cloud and On-Prem in the next blog.
Human Capital:
Designing, deploying, and maintaining the exemplary architecture that fulfils all the company’s requirements takes time and energy. We often ignore the resources involved in the project and for how long in the TCO calculation.
Cloud Service Providers (CSPs) Calculators
Each CSP has shared the Calculator for their customer so that they can roughly estimate their budget:
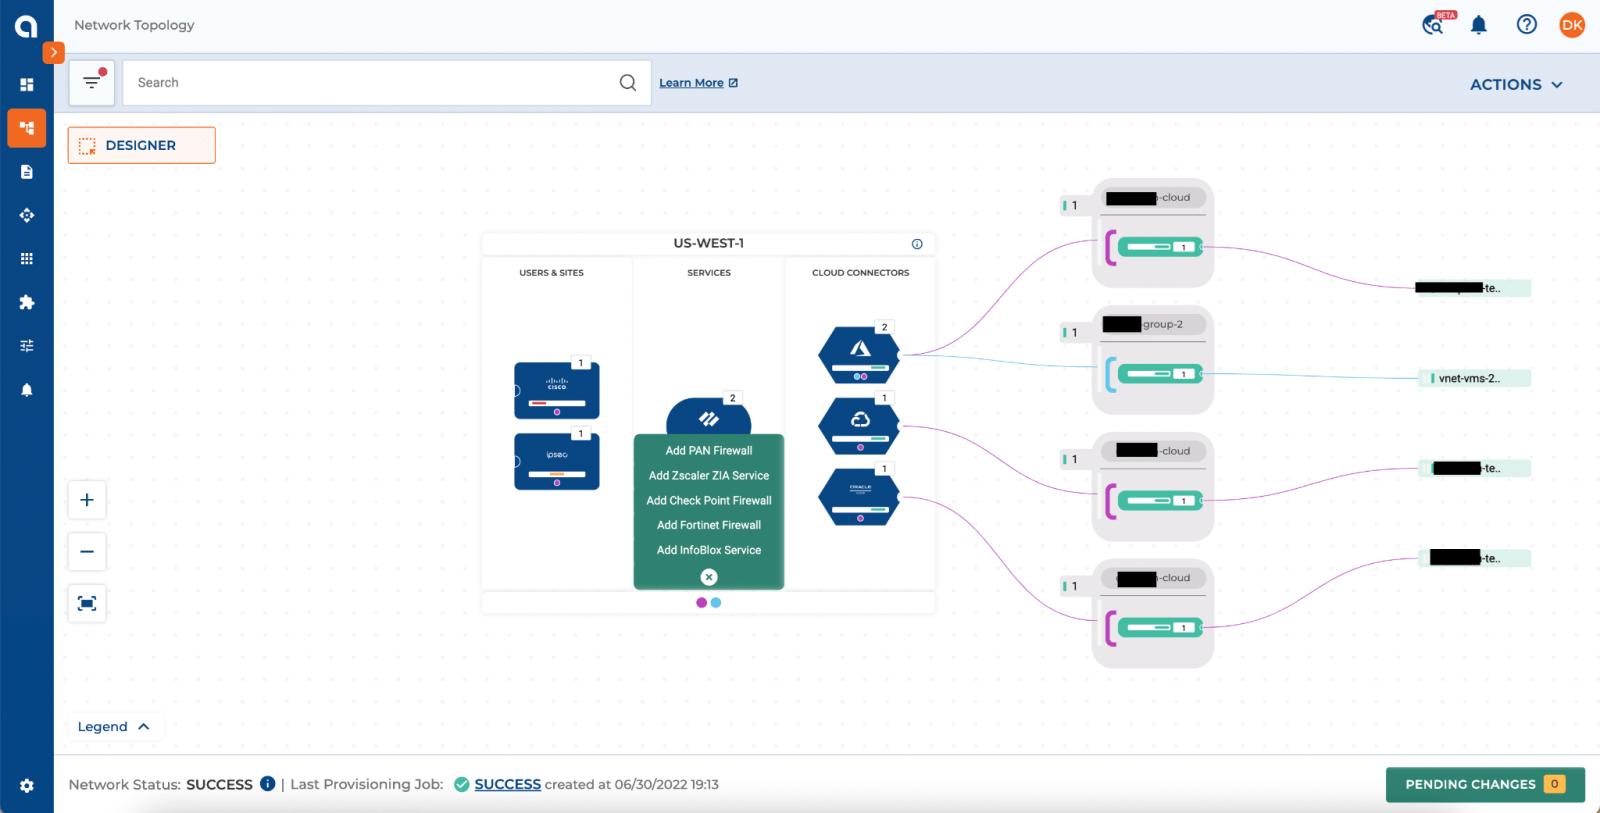
The scenarios below focus on a single cloud for traffic flow between vpc/vnet/vcns using the recommended CSP transit construct.
Scenario 1: Intra-Cloud without Firewall Insertion
This scenario focuses on communication between workloads in a single cloud environment between multiple VPCs/VNETs. In this scenario, the traffic between these VPCs/VNETs is not being inspected by the firewall.
Cloud Services & Parameters
Customer Requirements
Number of Region
1
Number of Instance per VPC
1
Bandwidth per Region
500 Mbps
Data Transfer between VPCs
5 GB/hour
Number of VPCs
10
Number of Instances
10
Total Number of Hours in a month
730
Total Number of Hours in a year
8760
EBS Storage
100 GB
Components Affecting Cost in Scenario 1
The components which will affect this scenario will be the CSP transit connection cost, data transfer charges and instance/virtual machine cost and storage costs associated with the instance/virtual machine.
AWS
S. No
Cloud Components
Unit Price
1
TGW Attachments
0.05/attachment
2
AWS Local Transit (TGW) – Data Transfer
0.02/GB
3
EC2 Instance – C5.xlarge (On-Demand)
0.17/hour
4
EBS Storage
$0.10 per GB-month of provisioned storage
Cost Calculation:
EC2 Compute Cost:
EC2 Instance cost per month
= EC2 Instance x Number of Hours / month
= 0.17 x 730
= $124.10 / instance
Similarly, Total EC2 instance cost per year
= EC2 Instance x Number of Hours/year
= 0.17 x 8760
= $1489.2 / instance
Total EC2 Compute Cost for above scenario
= $124.10 x 10 = $1,241 /month or
= $1489.2 x 10 = $14,892/year
Elastic Block Storage (EBS) Cost:
EBS Cost Storage per month Storage Used
= No. of Instances x Storage Cost/GB x Storage Used
= 1 Instance x 0.10 USD x 100 GB = 10.00 USD / instance
Total EBS Cost per above Scenario
= 10.00 USD x 10 = $100/month
Data Transfer Cost within same region:
Data Transfer = 5 GB / hour
Data Transfer Cost per hour
= Data Transfer/hour x Data Transfer Cost / GB = 5 x 0.02 = $0.1/hr
Data Transfer Cost per month
= Data Transfer Cost/hour x Total no. of hours/month = 0.1 x 730 = $73/instance
AWS Total Cost of Ownership (TCO)
Total AWS TCO per month
Total EC2 Compute Cost + Total EBS Storage Cost + Total Data Transfer Cost = $1,241 + $100 + $73 = $1,414 / month
OR
= $16,968 / year
Azure
S. No
Cloud Components
Unit Price
1
Azure VNet Peering Data Transfer Cost
0.01
2
vWAN Hub (Standard Hub)
0.25
3
Azure vWAN Data Processing (VNet to VNet)
0.04 (Includes #1 as well)
4
Virtual Machine – D4_v3 (PAYG)
0.234/hour
5
Standard SSD 128 GB
9.60/month
6
Storage Transaction
0.0020
Cost Calculation:
Azure Virtual Machine:
Virtual Machine (VM) cost per month
= VM Cost / hour x No. of Hours in a month = $0.234 x 730 = $170.82 / instance
Similarly, Total VM cost per year
= VM Cost / hour x No. of Hours in a year = 0.234 x 8760 = $2049.84 / instance
Total VM Cost as per Above Scenario
= $170.82 x 10 = $1,708.2 /month OR = $2049.84 x 10 = $20,498.4/year
Standard SSD Cost:
Standard SSD per month
= Number of Instance x Standard SSD 128 GB
= 1 Instance x 9.60 = $9.60 / instance
Total Managed Disks Cost as per above Scenario
= $9.60 x 10 = $96/month
Data Transfer Cost within same region:
Data Transfer = 5 GB / hour
Data Transfer Cost per hour
= Data Transfer/hour x Data Transfer Cost / GB = 5 x 0.04 = $0.2/hr/instance
Data Transfer Cost per month
= Data Transfer Cost /hour x Total No. of hours in a month = 0.2 x 730 = $146/instance
Azure Total Cost of Ownership
Total Azure TCO per month
= Total VM Cost + Total Disks Cost + Total Data Transfer Cost
= $1,708.2 + $96 + $146
= $1,950.2 / month
OR
= $23,402.4 / year
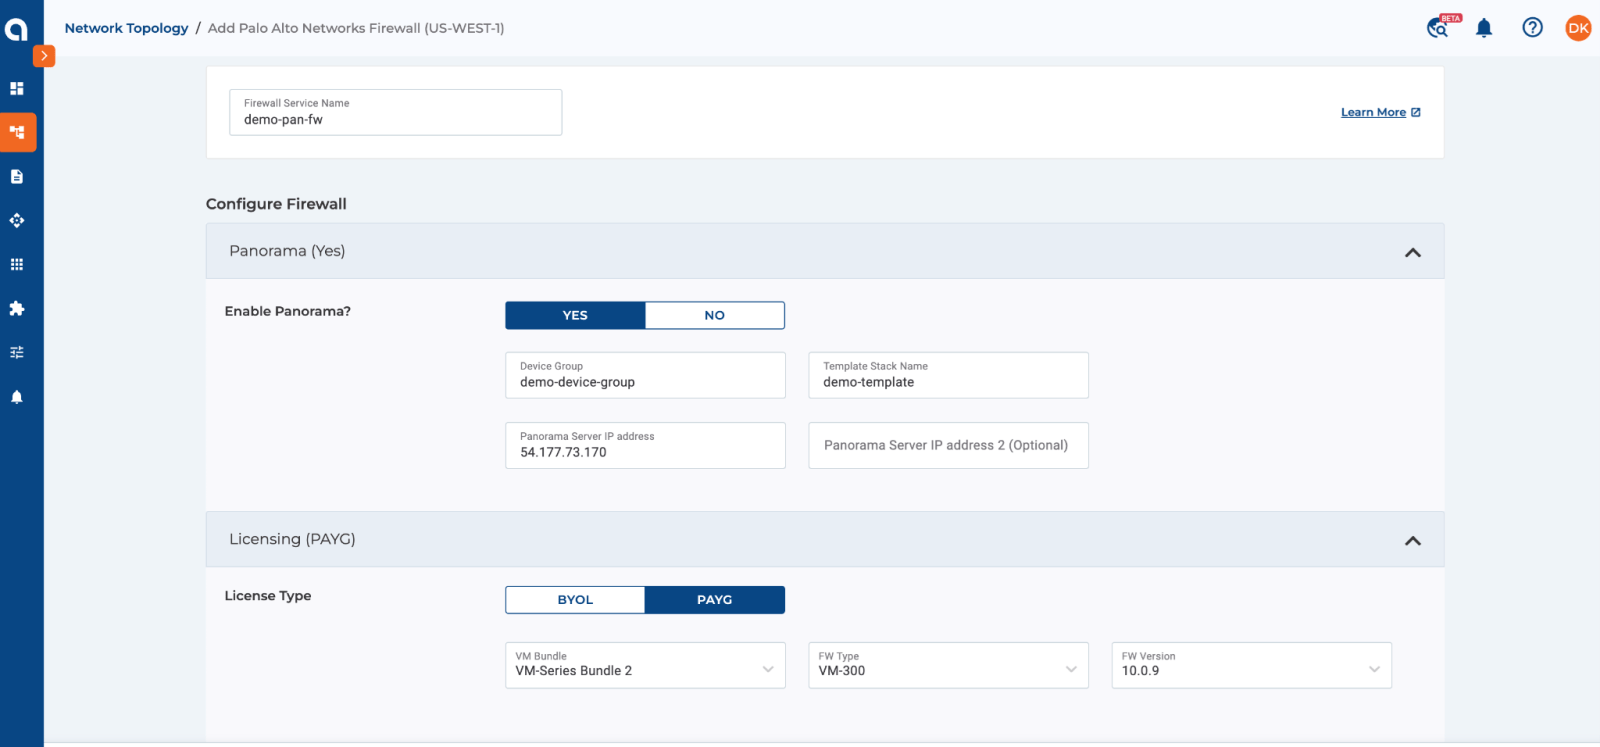
Scenario 2: Intra-Cloud with Firewall Insertion
This scenario focuses on communication between workloads in a single cloud environment between multiple VPCs/VNEts. In this scenario, the traffic between these VPCs/VNETs is being inspected by the firewall; hence those need to be accounted for when calculating the TCO.
Cloud Services & Parameters
Customer Requirements
Number of Region
1
Number of Instance per VPC
1
Bandwidth per Region
500 Mbps
Data Transfer between VPCs
5 GB/hour
Number of VPCs
10
Number of Instances
10
Total Number of Hours in a month
730
Total Number of Hours in a year
8760
EBS Storage
100 GB
Number of Firewall Instances per Region
2
Components Affecting Cost in Scenario 2
The components which will affect this scenario will be the CSP transit connection cost, data transfer charges and instance/virtual machine cost, storage costs associated with instance/virtual machine, and the FW costs as well.
One important thing to understand in this scenario in the case of AWS, which is commonly overlooked when customers do the TCO, is that the data leaves the origin VPC, goes to the security VPC, and goes to the destination VPC. It should be $0.04/GB, not 0.02/GB.
AWS
S. No
Cloud Components
Unit Price
1
TGW Attachments
0.05/attachment
2
AWS Local Transit (TGW) – Data Transfer
0.02/GB
3
EC2 Instance – C5.xlarge (On-Demand)
0.17/hour
4
EBS Storage
$0.10 per GB-month of provisioned storage
5
PAN Firewall
$1.964/hour
Cost Calculation:
EC2 Compute Cost:
EC2 Instance cost per month
= EC2 Instance x Number of Hours / month = 0.17 x 730 = $124.10 / instance
Similarly, Total EC2 instance cost per year
= EC2 Instance x Number of Hours/year = 0.17 x 8760 = $1489.2 / instance
Total EC2 Compute Cost for above scenario
= $124.10 x 10 = $1,241 /month or = $1489.2 x 10 = $14,892/year
Elastic Block Storage (EBS) Cost:
EBS Cost Storage per month
= No. of Instances x Storage Cost/GB x Storage Used = 1 Instance x 0.10 USD x 100 GB = 10.00 USD / instance
Total EBS Cost per above Scenario
= 10.00 USD x 10 = $100/month
Data Transfer Cost within same region:
Data Transfer = 5 GB / hour
Data Transfer Cost per hour
= Data Transfer/hour x ( Data Transfer Cost / GB to Security VPC + Data Transfer Cost / GB from Security VPC to Destination) = 5 x (0.02 + 0.02) = $0.2/hr
Data Transfer Cost per month
= Data Transfer Cost/hour x Total no. of hours/month = 0.2 x 730 = $146/instance
Similarly, TCO with other firewall vendors can also be calculated by plugging the respective PAYG cost for that particular firewall.
Firewall Vendors PAYG Cost per Instance
Palo Alto Networks (PAN)
Fortinet
Check Point
Cisco
$1.964 / hour Base Firewall + Threat Prevention (See Reference Above)
$1.84 / hour (c5n.large)
$1.102 / hour (c5.xlarge)
$1.17 /hour (c5.xlarge)
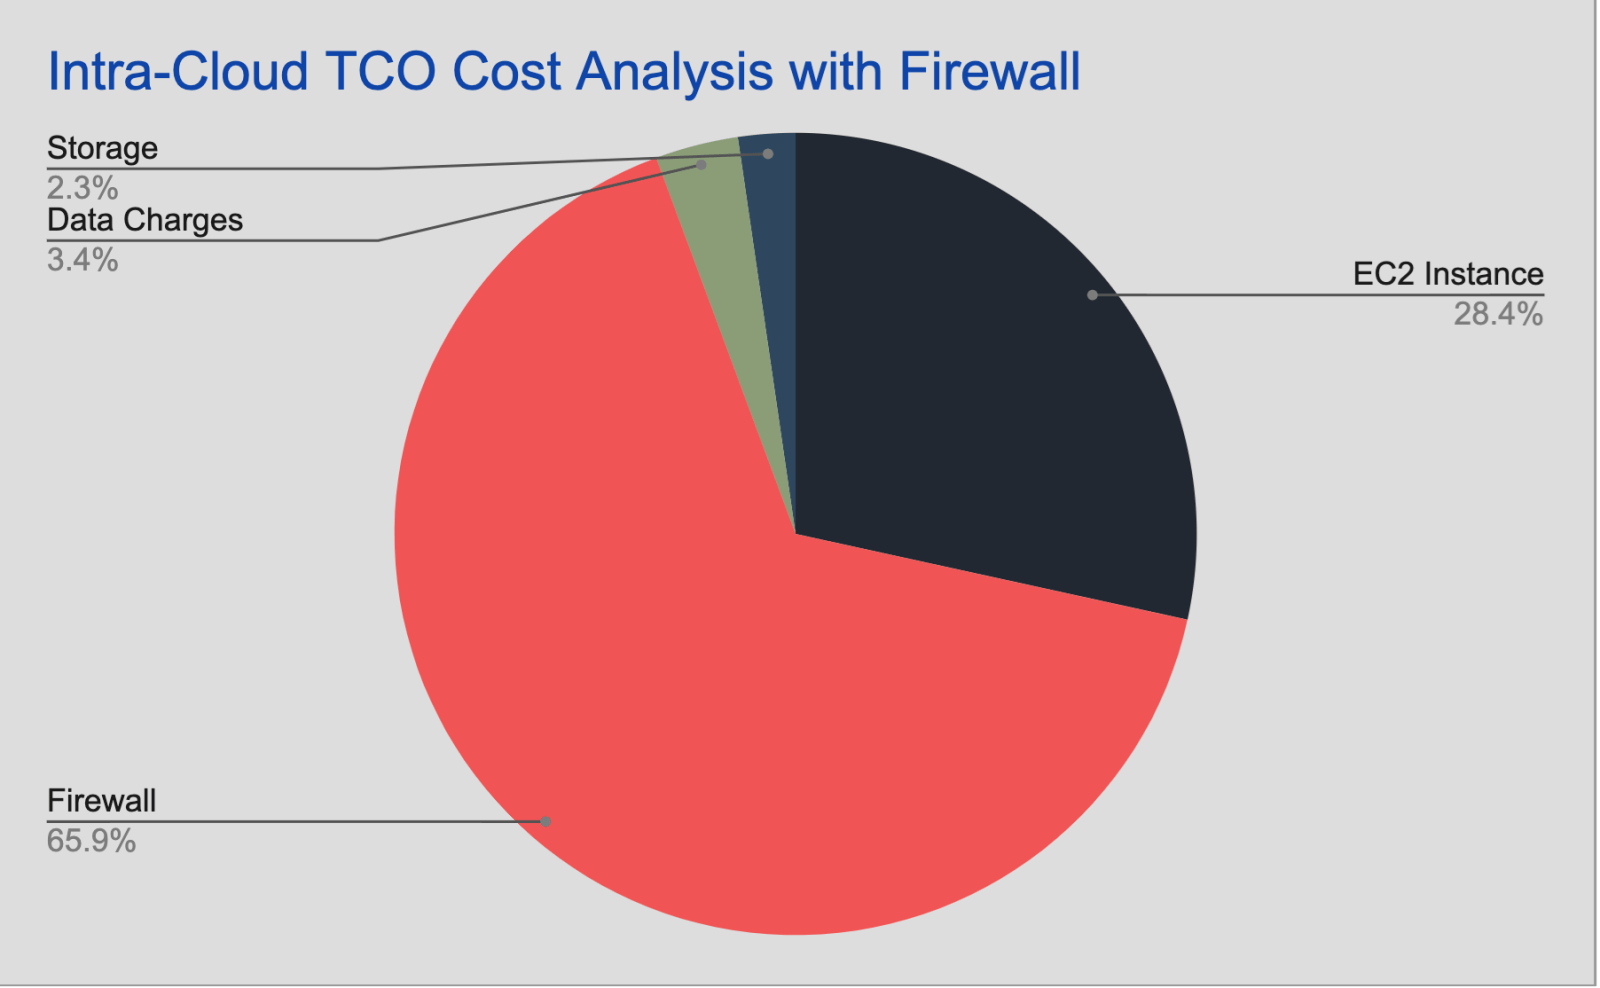
Analysis
This blog covers the basic intra-cloud scenarios which 99% of the enterprises use it Today and even if we see the cost distribution without taking into account the some of the major cost affecting factors it looks something like this:
Conclusion
This blog is focused on TCO analysis for the intra-cloud scenarios of different traffic flow between the VPCs, VNETs, or VCNs. Let’s summarize what we have learned in this blog.
Compute Cost is just a portion of overall TCO cost
CSPs charge data transition costs for intra-cloud scenarios, which differ for each Cloud Service Provider.
Architectural design and CSP preference will also affect the overall TCO
The following blog will detail the TCO calculation and analysis for Inter-cloud and on-prem scenarios.
Reach out and schedule a meeting with us if you have questions related to Cloud Total Cost of Ownership (TCO) or learn more about how Alkira can help simplify cloud area networking for your organization. You can also try our Cloud Insights tool for free, giving instant inventory and insights into your cloud networking resources.
Ahmed Abeer is a Sr. Product Manager at Alkira, where he is responsible for building a best-in-class Multi-Cloud Networking and Security Product. He has been in Product Management for more than ten years in different big and small organizations. He has worked with large enterprise and service provider customers to enable LTE/5G MPLS network infrastructure, automate Layer 3 Data Center, enable Next-Gen Multi-Cloud architecture, and define customers' Multi-Cloud strategies. Ahmed's technical expertise in Cloud Computing and Layer 2/Layer 3 network technologies. Ahmed is a public speaker at various conferences & forums and holds a Master's Degree in Computer Engineering.
DK
About the author
Deepesh Kumar
Deepesh Kumar is a Solutions Architect and product specialist in the computer networking industry with over 8 years of experience. He currently works as part of the post sales team at Alkira and focuses on working with customers to design and deploy the Alkira solution. Prior to working here, he worked at Viptela which was acquired by Cisco Systems. He holds a masters degree from San Jose State University.
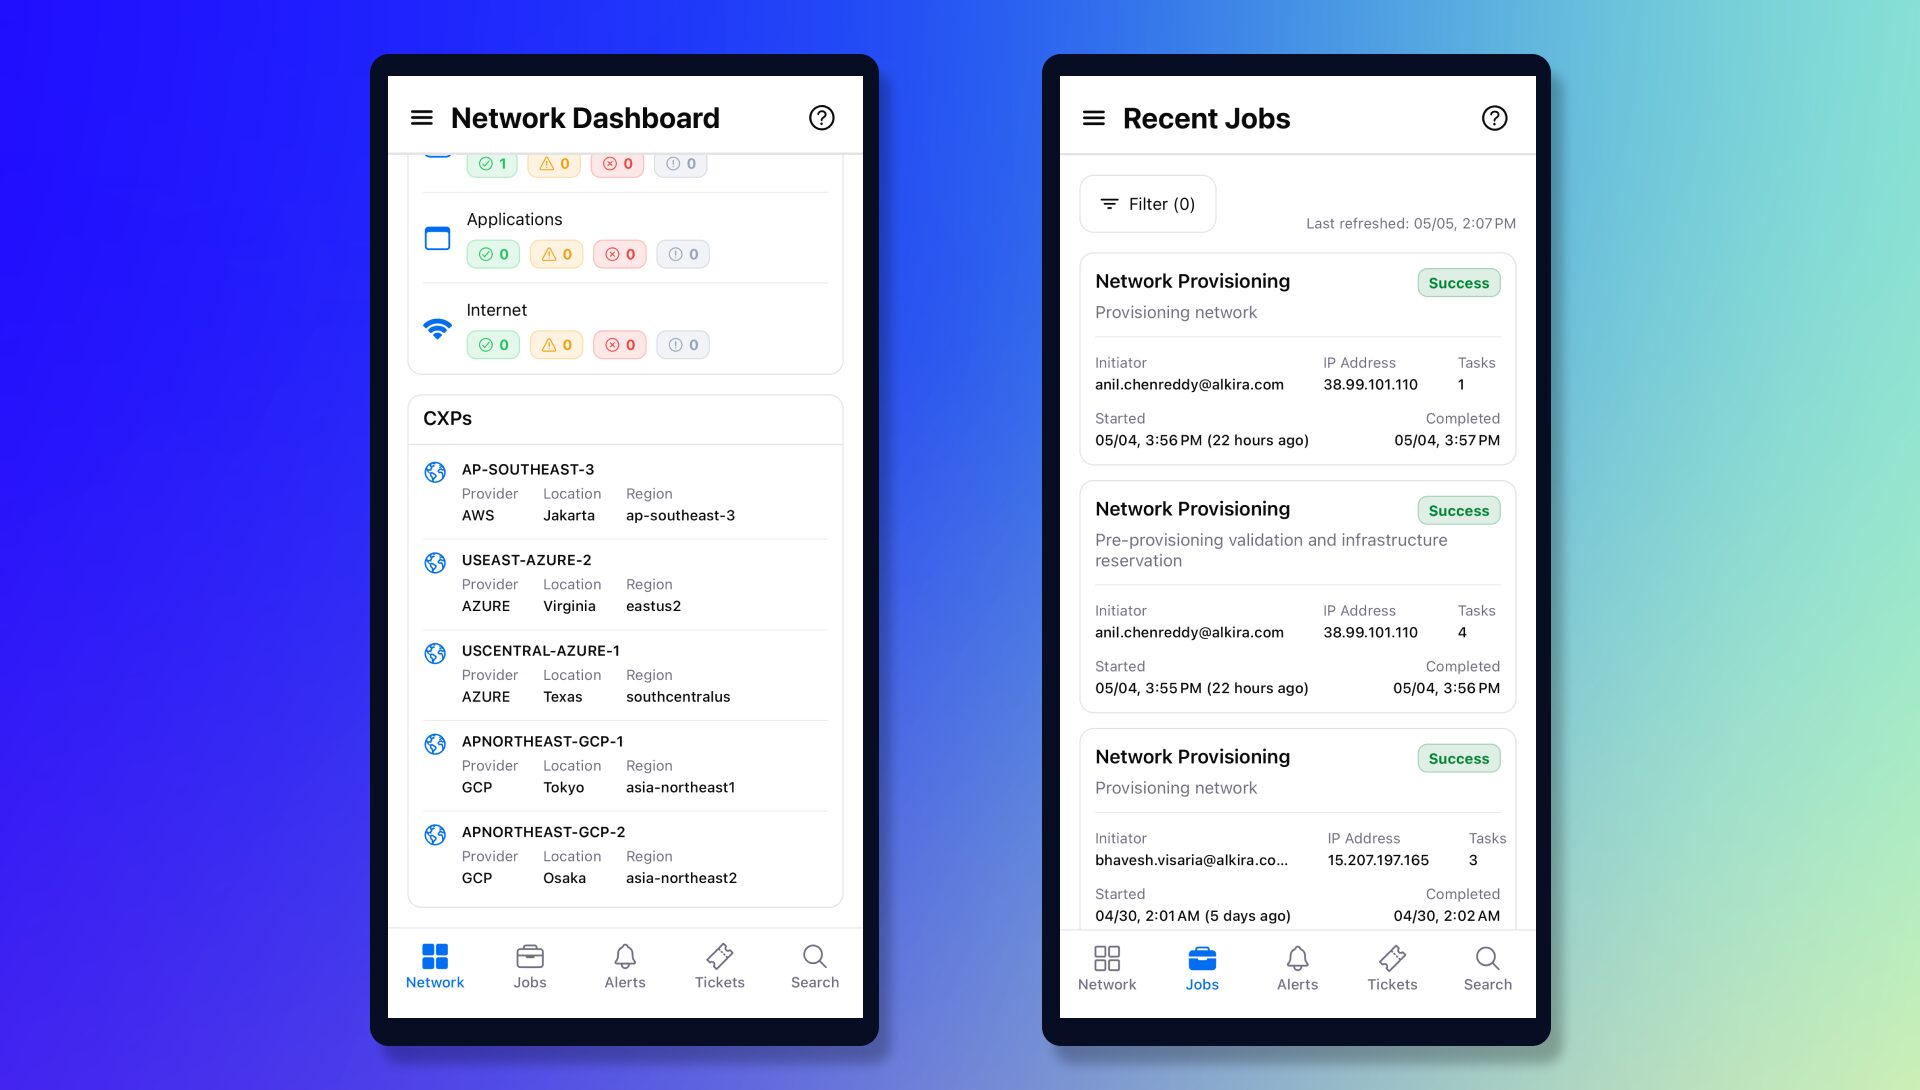
Enterprise networks are expected to run 24/7, and the teams responsible for them need visibility wherever work happens. Cloud environments, partner connections, security services, and provisioning workflows are constantly changing. When something needs attention, network and operations teams need a fast way to understand what happened, assess impact, and take the right next step. That...
Enterprises are moving quickly on AI, but many are still running networking models designed for a slower, more centralized and static era. Today’s network has to connect clouds, data centers, campuses, branches, partner environments, and increasingly private AI infrastructure while enforcing consistent policy across all of it. That creates a new operational reality: every new...
The Digital Operational Resilience Act (DORA) is reshaping how financial institutions in the European Union manage operational risk related to information and communication technology (ICT). As the regulation takes effect, organizations must ensure that their critical ICT service providers support strong operational resilience, risk management, and oversight capabilities. For technology providers supporting financial institutions, this...